Central Valley Water Map

Central Valley Water Map

Two maps of water in California's Central Valley, built by Will Gray from public records: depth to groundwater with a forecast, and the surface water delivered through the state and federal projects, the rivers and the Delta.

Both run in the browser, are free to use, and need no account.

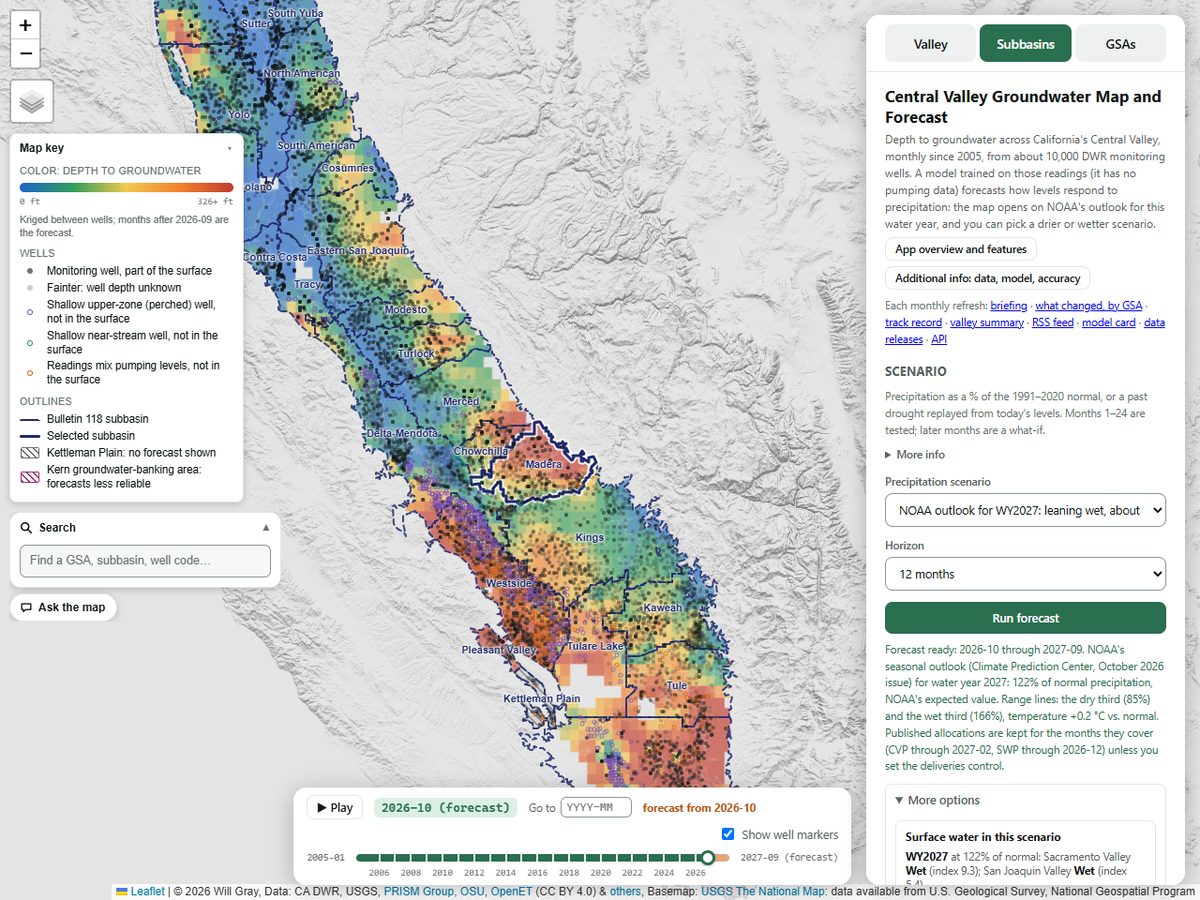
The groundwater map: the Central Valley colored by depth to groundwater, blue shallow to red deep, with the monitoring wells, the subbasin outlines, the map key, the month slider and the side panel's scenario and forecast controls.

Groundwater

Central Valley Groundwater Map and Forecast

Depth to groundwater across the Central Valley, monthly since 2005, from about 10,000 DWR monitoring wells. A model trained on those readings forecasts how levels respond to precipitation, up to 36 months ahead.

What it answers

  • How deep the water table is at any well or place, each month since 2005.
  • How levels change under a precipitation scenario, or when a past drought is replayed from today's levels. Months 1–24 are tested; later months are a what-if.
  • How a GSA's or subbasin's wells stand against the thresholds in its plan.
  • What changed in the latest monthly refresh, by GSA.
Also on this map

Open the groundwater map

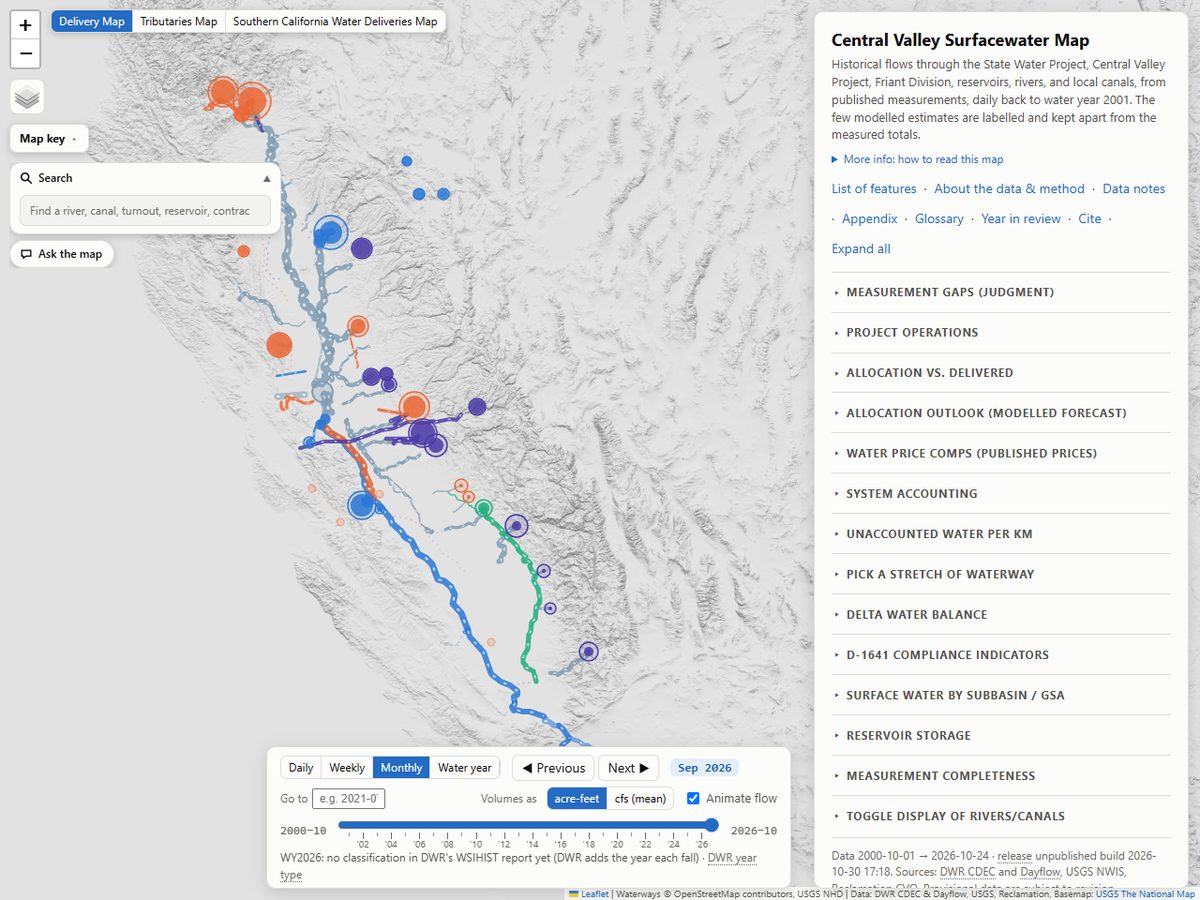
The surfacewater map's delivery view for September 2026: the project canals, rivers, reservoirs and delivery points drawn by volume, with the time slider and the side panel's list of sections.

Surfacewater

Central Valley Surfacewater Map

Surface water in the Central Valley: the State Water Project, the Central Valley Project, the Friant Division, rivers, reservoirs and the Delta, from published measurements, daily back to water year 2001.

What it answers

  • What each SWP and CVP contractor was allocated and what it received, by water year.
  • Daily flows, deliveries and storage on the projects, the rivers, the reservoirs and the Delta since water year 2001.
  • Whether the Bay-Delta outflow, X2, export and salinity requirements of D-1641 were met, month by month.
  • Where water enters and leaves each reach of the canals and the Sacramento River.

Three maps on one page

Open the surfacewater map

Citing and reusing the outputs

The outputs of both maps (the forecasts, estimates, charts, tables and downloads) are released under CC BY-NC 4.0 (cite Gray, W.). Additional permission: public agencies, groundwater sustainability agencies, consultants working for them, and academic researchers may also use the outputs for commercial purposes, with the same credit. Other commercial use needs the author's written permission. Releases published before the change to CC BY-NC 4.0 remain under CC BY 4.0. The inputs keep their own terms, listed with every source in each map's About dialog.

Groundwater map
Gray, W. Central Valley Groundwater Map and Forecast. Central Valley Water Map, https://groundwater.cvwatermap.com/.
Surfacewater map
Gray, W. Central Valley Surfacewater Map. Central Valley Water Map, https://surfacewater.cvwatermap.com/.

Each map's Cite button adds the frozen release id and the date, so a number can be traced to the release it came from.